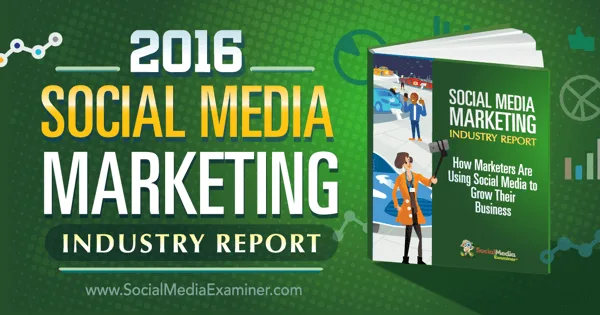
The annual Social Media Marketing Industry Report is the most complete picture available of how businesses actually work in social media. We have translated the fifth part of the 2016 report: return on investment, Facebook effectiveness, the time spent on promotion, and a profile of the 5,086 marketers who answered the questions. It will save you roughly 35 minutes of reading the English original.
Social media marketing keeps evolving. As this year's report shows, SMM has become the most important pillar for the modern entrepreneur. The study is full of ideas that are easy to take in — about how social media can be used right now and how to plan its use going forward. After reading this material you will have answers to every "who, what, where, when and why" in the field of SMM. More than 5,000 marketers shared their experience in the survey, and you will not find their opinions anywhere else.
Key findings of the report
Below is a brief summary of the survey results. This is the minimum worth knowing, even if you do not read a single further figure.
- Video has grown in importance. 60% of marketers use video in their work, and 73% plan to increase the volume of video they produce.
- Live video is taking the stage. 50% of marketers plan to use real-time video streaming services such as Facebook Live and Periscope, and another 50% want to learn more about the format.
- Facebook and YouTube are the main directions for growth. At least 63% of market participants plan to expand their presence on exactly these networks.
- Snapchat has entered a growth trajectory. Only 5% of marketers use Snapchat, but 16% plan to increase their activity in the app, and a further 28% would like to learn more about it.
- Facebook is unquestionably the most important network. When participants were asked to choose the single most significant platform, 55% named Facebook and 18% named LinkedIn. On top of that, 67% of respondents plan to grow their marketing activity specifically on Facebook.
- There is no confidence in the results. 40% of marketers do not know whether their traffic from Facebook has fallen over the past 12 months, and 35% are unsure about the effectiveness of their promotion on the network.
- Facebook advertising dominates. Surprisingly enough, 86% of marketers regularly use Facebook ads, while only 18% use Twitter ads.
- Tactics and engagement are the top topics to learn about. No fewer than 90% of respondents want to learn about the most effective SMM tactics and the best ways to engage an audience on social media.
Measuring the return on investment in SMM
What ways are there to assess social media activity? Participants were asked to rate how strongly they agreed with a single statement.
I can measure the return on investment (ROI) of my social media promotion.Statement from the study questionnaire
Only 41% answered that they are able to do so. The question of return has been troubling marketers for years now, and the trend here has barely moved.
| Year of the study | Can measure ROI |
|---|---|
| 2014 | 37% |
| 2015 | 42% |
| 2016 | 41% |

How effective is Facebook marketing
When asked whether they agreed with the statement "My Facebook marketing is effective", 46% of respondents said yes. In 2015 the figure was 45%. In other words, the majority either hesitate to answer or say outright that Facebook promotion does not work for them.
Notably, B2C market participants chose "agree" or "strongly agree" far more often than their B2B colleagues.
B2C segment
52% of marketers consider their Facebook marketing activity effective. An audience of end customers naturally lives on this network, so the returns are more visible.
B2B segment
Only 38% agree that their Facebook marketing works. For reaching a business audience the platform delivers a noticeably more modest result.
Another pattern the study recorded is the link with experience. Marketers who have been using SMM for one or two years rate the effectiveness of their Facebook promotion differently from newcomers: the longer the track record with social media, the more confident the answers.
Social media alongside traditional channels
81% of marketers confirmed that they really do use social media together with traditional marketing tools and channels. That is slightly below 2015, when the same figure stood at 84% of respondents.
At the same time, working in social media is getting harder. 40% of marketers agree with the statement: "Social media marketing is more difficult for me than it was 12 months ago."
Blogs optimized for mobile devices
Marketers who run blogs were asked to rate how strongly they agreed with the statement "My blog is optimized for reading on mobile devices". Here, unlike the return-on-investment figure, the trend is steadily positive.
| Year of the study | Have a mobile-optimized blog |
|---|---|
| 2014 | 43% |
| 2015 | 50% |
| 2016 | 54% |
Among marketers working in the B2B segment the share of mobile-optimized blogs is higher — 62%, compared with 51% in the B2C segment.
How many hours a week SMM takes
Social media is not "half an hour in the evening". The study shows that for a significant part of the market it is a full workload.
- 63% of marketers spend 6 hours a week or more on social media marketing activity.
- 39% spend 11 hours or more every week.
- About 19% of entrepreneurs give social media more than 20 hours a week.

The experience factor
There is a direct link between how long marketers have been using SMM and the time they devote to it. Among those only starting out with social media promotion (less than 12 months of experience), 54% spend 5 hours a week or less. By contrast, among those with two years of experience or more, at least 64% spend 6 hours or more every week on various SMM activities.
The effect of company size
A separate chart in the report shows how companies of different sizes invest their time in social media: the larger the headcount, the differently the weekly SMM workload is distributed.
B2B versus B2C: different networks
The study compares social media use in the two segments separately. The difference is systematic: companies working with the end customer and companies selling to business effectively live on different platforms.
| Segment | Networks marketers focus on |
|---|---|
| B2C | Facebook, YouTube, Instagram, Pinterest |
| B2B | LinkedIn, Twitter, Google+, SlideShare |
The most important social platform
Marketers were asked to choose the single social network most significant for their business. Since only one option was allowed, the results leave no room for doubt.

More than half of marketers (55%) chose Facebook as their primary platform, followed by LinkedIn (18%), Twitter (12%) and then YouTube (4%). The chart clearly shows that Facebook is still the main venue of activity for marketers.
| Platform | 2015 | 2016 |
|---|---|---|
| 52% | 55% | |
| 21% | 18% | |
| 13% | 12% |
The dramatic differences between marketers working with the B2B and B2C segments are worth noting. Facebook clearly dominates the B2C market: 66% of entrepreneurs named it their main channel. For B2B marketers, however, LinkedIn proved far more important — it comes out ahead of even Facebook.
Who took part in the survey
Participants were recruited by email. The survey ran in January 2016: invitations to take part were sent to the addresses of 400,000 marketers. After 5 days the survey closed, with 5,086 respondents having taken part.
The largest group of participants (38%) works in small business — companies with 2–10 employees. Next come the self-employed (23%). Another 18% of respondents work in commercial organizations with a headcount of 100 or more. More than half of the sample (65%) are marketers from the B2C segment, the remaining 35% from B2B.
A separate chart in the report shows the breakdown of participants by industry.
Age, gender and geography
- Age. The majority of survey participants (69%) fall into the 30 to 59 age bracket.
- Gender. Women edged ahead of men, making up 57% of all participants.
- Country. Most participants (52%) work in the USA, followed by the United Kingdom (8%), Canada (6%) and Australia (4%).